No data from elastiflow on ELK

Hello, I’m rather new to the whole logging stack.
And I need help. The goal is to get traffic flow from mikrotik to my ELK server:

This is my elastiflow/flowcoll.yml:
EF_ACCOUNT_ID: 6881d7a878b9253ef4a85a14
EF_LICENSE_ACCEPTED: true
EF_LICENSE_KEY: “Key”

EF_LOGGER_DEVELOPMENT_ENABLE: “true”
EF_LOGGER_ENCODING: console

EF_LOGGER_FILE_LOG_ENABLE: “true”
EF_LOGGER_FILE_LOG_FILENAME: /var/log/elastiflow/flowcoll/flowcoll.log

EF_LOGGER_LEVEL: debug

EF_FLOW_SERVER_UDP_IP: ELK_IP
EF_FLOW_SERVER_UDP_PORT: 2055,4739,6343,9995

EF_PROCESSOR_DECODE_IPFIX_ENABLE: “true”
EF_PROCESSOR_DECODE_NETFLOW5_ENABLE: “true”
EF_PROCESSOR_DECODE_NETFLOW7_ENABLE: “true”
EF_PROCESSOR_DECODE_NETFLOW9_ENABLE: “true”
EF_PROCESSOR_DURATION_PRECISION: ms
EF_PROCESSOR_KEEP_CPU_TICKS: “true”
EF_PROCESSOR_PERCENT_NORM: 100
EF_PROCESSOR_POOL_SIZE: 0
EF_PROCESSOR_TIMESTAMP_PRECISION: ms
EF_PROCESSOR_TRANSLATE_KEEP_IDS: default

EF_OUTPUT_ELASTICSEARCH_ADDRESSES: 127.0.0.1:9200
EF_OUTPUT_ELASTICSEARCH_ALLOWED_RECORD_TYPES: as_path_hop,flow_option,flow,ifa_hop,telemetry,metric,log
EF_OUTPUT_ELASTICSEARCH_CLIENT_CA_CERT_FILEPATH: ca.crt
EF_OUTPUT_ELASTICSEARCH_CLIENT_CERT_FILEPATH: elasticsearch.crt
EF_OUTPUT_ELASTICSEARCH_CLIENT_KEY_FILEPATH: elasticsearch.key
EF_OUTPUT_ELASTICSEARCH_ECS_ENABLE: “true”
EF_OUTPUT_ELASTICSEARCH_ENABLE: “true”
EF_OUTPUT_ELASTICSEARCH_INDEX_PERIOD: rollover
EF_OUTPUT_ELASTICSEARCH_INDEX_TEMPLATE_CODEC: best_compression
EF_OUTPUT_ELASTICSEARCH_INDEX_TEMPLATE_ENABLE: “true”
EF_OUTPUT_ELASTICSEARCH_INDEX_TEMPLATE_ILM_LIFECYCLE: elastiflow
EF_OUTPUT_ELASTICSEARCH_INDEX_TEMPLATE_REFRESH_INTERVAL: 20s
EF_OUTPUT_ELASTICSEARCH_INDEX_TEMPLATE_REPLICAS: 0
EF_OUTPUT_ELASTICSEARCH_INDEX_TEMPLATE_SHARDS: 3
EF_OUTPUT_ELASTICSEARCH_MAX_RETRIES: 1
EF_OUTPUT_ELASTICSEARCH_PASSWORD: _k9qx00x26BemjcEu7IX
EF_OUTPUT_ELASTICSEARCH_RETRY_BACKOFF: 1000
EF_OUTPUT_ELASTICSEARCH_RETRY_ENABLE: “true”
EF_OUTPUT_ELASTICSEARCH_STORAGE_OPTIMIZATION_ENABLE: “true”
EF_OUTPUT_ELASTICSEARCH_TIMESTAMP_SOURCE: collect
EF_OUTPUT_ELASTICSEARCH_TLS_CA_CERT_FILEPATH: “/etc/elasticsearch/certs/ca.crt”
EF_OUTPUT_ELASTICSEARCH_TLS_ENABLE: “true”
EF_OUTPUT_ELASTICSEARCH_TSDS_ENABLE: “true”
EF_OUTPUT_ELASTICSEARCH_USERNAME: elastic

Mikrotik routerOS 7 config:
/ip traffic-flow target print
Columns: SRC-ADDRESS, DST-ADDRESS, PORT, VERSION
SRC-ADDRESS DST-ADDRESS PORT VERSION
0 Mikrotik ELK_IP 4739 ipfix

/ip traffic-flow print
enabled: yes
interfaces: all
cache-entries: 32k
active-flow-timeout: 1m
inactive-flow-timeout: 15s
packet-sampling: no
sampling-interval: 0
sampling-space: 0

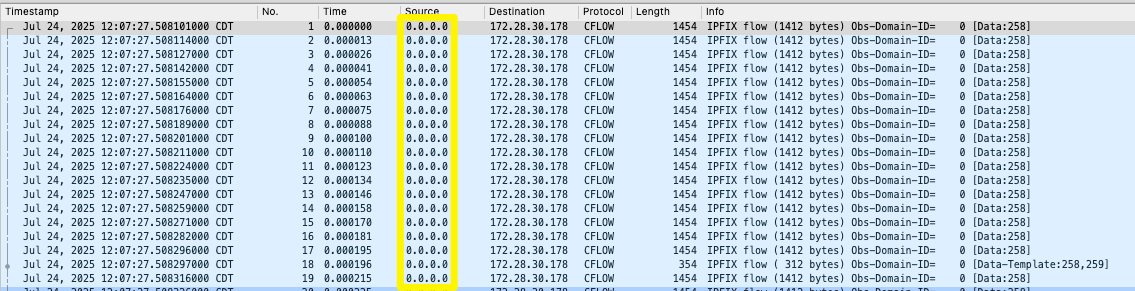
Tcpdump from server is:
tcpdump -n -i any udp port 4739:
17:46:21.636100 ens33 In IP Mikrotik.4739 > ELK_IP.4739: UDP, length 1412
101 packets captured
103 packets received by filter
0 packets dropped by kernel
So I know the 2 are connected, however I don’t have logs or data.
Flowcoll.service is running, seen in log:
flowcoll.elasticsearch_output[default] …
healthcheck success; connection is available {“address”: “127.0.0.1:9200”}
request succeeded {“address”: “127.0.0.1:9200”}
I have imported ECS kibana data, not codex. My user Flow_read has “monitor” under cluster privilege and “read, view_index_metadata, create_index, write” under Index privileges, with “elastiflow-flow-ecs-, elastiflow-path-esc- and elastiflow-telemetry_flow-esc-*”, but no logs or any data whatsoever.
When I started elastiflow I did got 2 new indices, “elastiflow-path-ecs-8.0-2.5-rollover-000001” and “elastiflow-telemetry_flow-ecs-8.0-2.5-rollover-000001” both with 0 Documents count and 747b of size.

If I’m missing some config file do tell.
Obviously I’m missing something so if anybody can point me in right direction I would be most grateful.
Cheers

I would change EF_LOGGER_DEVELOPMENT_ENABLE to the default value of “false.”
I would change the log level from debug to info (the default).

It’s not clear to me what you mean by “My user Flow_read has “monitor” under cluster privilege…”
Is this a user you have created to log in to Kibana?

After those changes, stop the collector, clear out the log file, restart the collector, and check the logs for any errors. I would also check the output of journalctl -n 200 -u flowcoll.service to see if there are any startup errors that are not in the log file.

I would also save the packet capture to file and then view the pcap in wireshark to be sure you are receiving templates and flow records.

Let us know if what errors you encounter or any other information you find.

Regards,
Dexter Turner

Hi,
debug was only in hopes to see something useful from logs but to no avail. pcap file does show flow, since I can see, src addr, dst addr, ports, next hop, TCP flags and so on in wireshark, meaning mikrotik is sending it and ELK server is receiving the data. journalctl as well as tail log didn’t show any errors, no startup glitches, nor anything of value, just:
“flow_processor flowprocessor/flow.go:39 flow record processor is running
flowcoll.bootstrapper[elasticsearch].component_template_manager[elasticsearch] templates/handler_component.go:75 component template chunk 26/27 created successfully
flowcoll.bootstrapper[elasticsearch] search_utils/writeindex.go:81 ‘elastiflow-telemetry_flow-ecs-8.0-2.5-rollover’ already exists, skipping write index creation
flowcoll.elasticsearch_output[default] httpoutput/healthcheck_runner.go:70 healthcheck success; connection is available {“address”: “127.0.0.1:9200”}” and such. Systemctl status flowcoll shows no error.
So that could mean my index config or ingesting data into kibana is bad? Since I get the flow but see nothing in dashboard.

If you are receiving data on the UDP ports and the flow collector has a successful connection to Elasticsearch there are a couple of reasons for not seeing data as expected.

“templates not received” … Flow records are received but the necessary templates to decode the records are not received. This would be recorded in the logs as “template not yet received.”

receiving ‘telemetry’ flow records, but not IPFIX/NetflowV9 records … In this case you would see records in the ‘telemetry’ index but not the ‘flow’ index. Check all the indices listed under ‘Index Management’ to see if any documents exist in any ‘elastiflow-*’ indices.

wrong dashboards … Using the ‘codex’ dashboards when ‘ecs’ is enabled or vice-versa. You mentioned you were using ECS and imported ECS dashboards so that is likely not the issue.

timing … Since you are running both the flow collector and elasticsearch on the same machine this is unlikely to be a problem, but I have seen instances where the flow collector server has a time zone setting and Elasticsearch is running on UTC time so when records arrive they have an earlier or later timestamp that do not show up when data is filtered for “last 15 minutes.”

If you want to share the PCAP I can review what the collector is receiving. The flowcoll.log would be helpful, too. You can DM me here and I will reply with details on how to send me the files to review.

I can send you the .log, not so sure of pcap as it’s a company’s network.

Hi,

I got the files you provided and don’t see any misconfiguration or errors in the logs. I was able to replay the PCAP file locally and I can see the flow records in my local test system so the flow records look valid.

I did notice that the flow records have a source address of 0.0.0.0 which seems odd. Can you tell me where / how this packet capture was collected?

The flowcoll.log shows that it starts and runs without errors, but there is nothing in the log that indicates it is processing flow records.

Things I can think of to check are:

  • is there a firewall running? - if the pcap was collected on the flowcoll server then this is likely not an issue, but it’s worth checking

  • consider changing the UDP server address to 0.0.0.0 - it is specifically set to 172.28.30.178 in the config file, but using 0.0.0.0 will have it listen on all interfaces

  • use a very scaled down flowcoll.yml for testing - I will send you a minimal file to test with. It’s a good practice to start with ‘bare minimum’ settings for initial start up and then incrementally make changes as you need

I will send you a flowcoll.yml file to test with using your license, elasticsearch settings, etc. Note that I did not enable TSDS which was enabled in your configuration since I was aiming for a “minimal” configuration.

Once you get the file you will need to do the following:
stop the flowcoll.service - sudo systemctl stop flowcoll.service
backup your existing configuration file - sudo cp /etc/elastiflow/flowcoll.yml ~/flowcoll.yml.backup
copy the new configuration into place - sudo cp ~/flowcoll.yml.new /etc/elastiflow/flowcoll.yml
log in to Kibana, go to ‘Stack Management’ and remove all ‘elastiflow-’ indices and all 'elastiflow-’ index templates.
[optional] clear the existing log file to make troubleshooting the new startup easier - sudo truncate -s 0 /var/log/elastiflow/flowcoll.log
restart the flowcollector - sudo systemctl start flowcoll.service

Let us know if this helps or what you observe.

Regards,
Dexter Turner

The error was rather simple. The “target” segment on router was misconfigured. Thx Dexter for the help along the way.
Cheers

1 Like